In the first part of this blog series, Do You Know Your Assets?, we explored the importance of threat modeling for manufacturing companies, as well as the CERTAINITY modeling approach and its underlying meta-model. This modeling technique enables comprehensive threat and risk modeling and assessment across three levels of abstraction.
This blog post focuses on the CERTAINITY threat modeling methodology for manufacturing companies, based on the data flow model introduced in the previous article.
The following sections describe the recommended methodology and demonstrate how it enables organizations to identify, assess, and mitigate threats during the design phase. This helps manufacturers develop more secure systems while supporting compliance with the European Cyber Resilience Act and the IEC 62443 standards.
Threat Modeling and Risk Assessment
Threat modeling is performed by applying the Failure Mode and Effects Analysis (FMEA) methodology to the individual elements of the data flow model.
FMEA is a structured risk analysis method used to identify potential failures in complex systems or processes before they occur. It helps manufacturing organizations identify security and reliability weaknesses during the design phase and define preventive or corrective measures.
For threat modeling with FMEA, the MITRE ATT&CK Matrix for ICS is used to analyze potential attack techniques against individual model elements. The matrix provides a knowledge base of tactics and techniques used by known adversaries targeting industrial environments, based on real-world observations. It organizes the phases of the attack lifecycle and the corresponding platforms into a matrix, with tactics represented as columns and techniques as rows. Each technique includes example attacks, objectives, mitigation strategies, and detection methods.
Figure 1 illustrates the phases of the recommended threat modeling methodology for complex systems. Each phase is described in detail below.
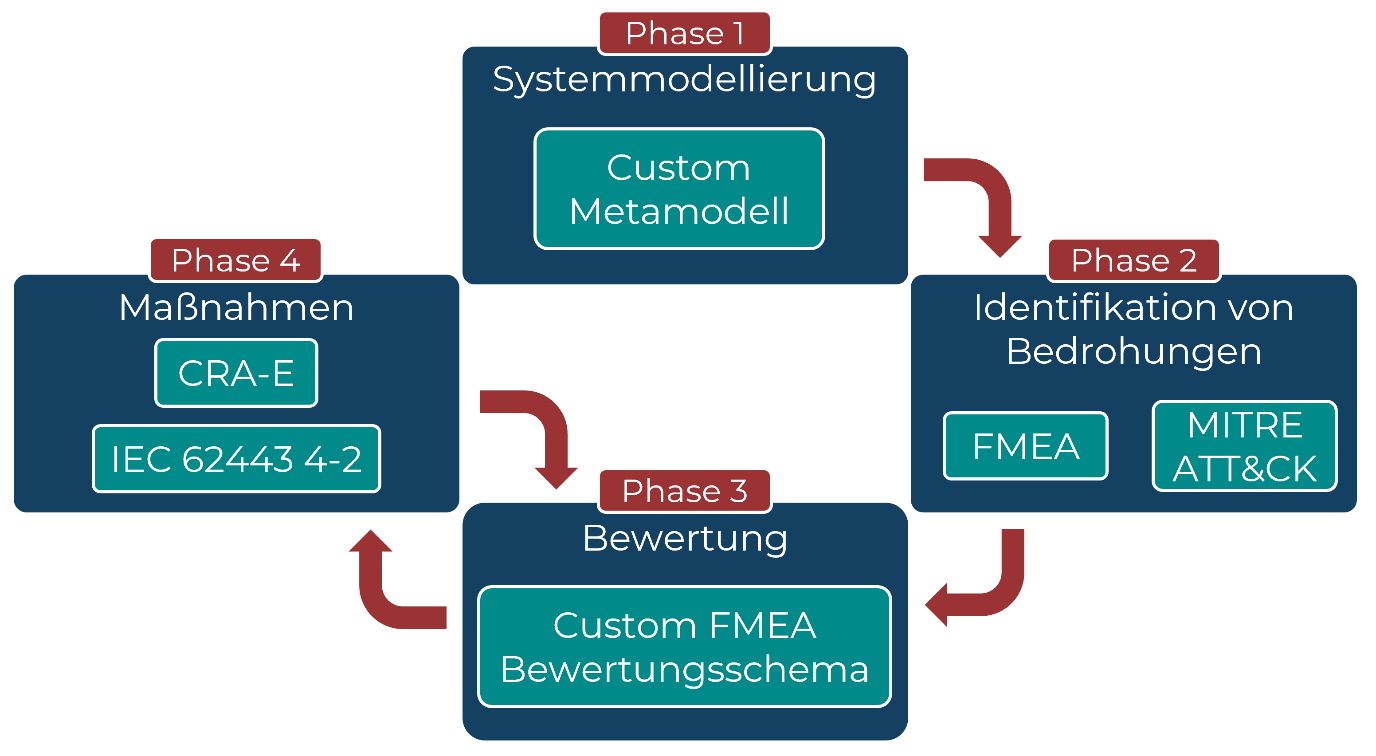
Figure 1: Threat modeling phases
PHASE 1:
During the first phase, the system is described and modeled. The CERTAINITY modeling approach can be used for this purpose. The meta-model must be adapted to the specific system under assessment. The resulting data flow diagram serves as the foundation for analyzing system components and their interactions with respect to potential threats and evaluating the impact of those threats. Phase 2 focuses on threat identification, while Phase 3 addresses threat assessment.
PHASE 2:
In Phase 2, potential failures, their causes, and their consequences are analyzed.
First, potential failures within the system are identified using the data flow diagram, the MITRE ATT&CK Matrix for ICS, and knowledge gained from previous security incidents. Relevant attack tactics from the MITRE ATT&CK Matrix are evaluated together with their associated techniques and documented in a structured table. Findings from previous incidents are also taken into account.
Next, the potential impact of each failure on users and the affected model elements is documented, along with possible methods for detecting exploitation attempts. Once this information has been completed, the process moves on to the next phase.
PHASE 3:
The third phase focuses on evaluating and prioritizing the identified threats.
Three factors are considered during the assessment:
- Probability of occurrence (P)
- Severity of impact (S)
- Probability of detection (D)
The resulting risk value (R) is calculated by multiplying these three factors:
R = P × S × D
Each organization may define its own assessment scale. For illustration purposes, this methodology uses a simple four-level scale ranging from 1 to 4 for each criterion.
The Probability of Occurrence (P) represents the likelihood that a particular threat will materialize. The proposed rating is based on the Security Levels (SL) defined in IEC 62443-3-3, which reflect the capabilities required by an attacker. As the complexity of exploiting a vulnerability increases, the probability of occurrence decreases.
Table 1 describes the different attacker types. The probability of occurrence depends on the attacker’s available resources, capabilities, motivation, and means. For example, in the case of a careless user, a threat may already materialize through a single negligent action.
Table 1: Attacker capability profiles
| Attacker Type | Resources | Capabilities | Skills | Motivation |
|---|---|---|---|---|
| State-sponsored | Sophisticated | High | ICS-specific | High |
| Hacker | Sophisticated | Medium | ICS-specific | Medium |
| Opportunistic attacker | Basic | Low | Generic | Low |
| Careless user | Basic | Low | Generic | Low |
Table 2 maps the attacker types shown in Table 1 to the corresponding probability of occurrence and the Security Levels defined in IEC 62443. The easier a vulnerability is to exploit, the higher its probability of occurrence.
Table 2: Mapping attacker types to probability of occurrence and IEC 62443 Security Levels
| Attacker Type | Probability of Occurrence | Security Level |
|---|---|---|
| State-sponsored | 1 (very low) | SL 4 |
| Hacker | 2 (low) | SL 3 |
| Opportunistic attacker | 3 (medium) | SL 2 |
| Careless user | 4 (high) | SL 1 |
The Severity (S) criterion measures the impact of a potential threat on a scale from 1 to 4. The severity levels are described in Table 3.
Table 3: Severity levels
| Severity | Description |
|---|---|
| 1 (very low) | Negligible business impact; only isolated processes are affected. |
| 2 (low) | Limited business impact; only a small number of processes are affected. |
| 3 (medium) | Significant business impact affecting numerous, including non-critical, business processes. |
| 4 (high) | Severe business impact affecting the majority of business processes. |
The final criterion used in the threat assessment is Detection (D), which measures the likelihood that exploitation of a vulnerability can be detected or mitigated. The assessment uses a scale from 1 to 4, where 1 indicates that detection or mitigation is very easy and 4 indicates that it is difficult.
As the final step, the values for probability of occurrence, severity, and detection are multiplied to determine the risk value of the threat. Table 4 shows possible consequences based on the calculated risk value. The values for X and Y must be adapted depending on the criticality of the system. Threats are then prioritized according to their risk value. Once the threats have been assessed and prioritized, they must be treated appropriately, which takes place in Phase 4.
Table 4: Consequences based on the calculated risk value, based on the Organisationshandbuch
| Risk Value | Failure Risk | Need for Action | Measures |
|---|---|---|---|
| R > Y | High | Urgent action required | Must be defined and implemented |
| X ≤ R ≤ Y | Medium | Action required | Should be defined and implemented |
| 2 ≤ R ≤ X | Acceptable | No mandatory action required | May be defined and implemented |
| R = 1 | None | None | None |
PHASE 4:
In Phase 4, security measures are defined to mitigate the identified risk scenarios. These measures are based on the risk value and the attacker types. The risk value determines the urgency of treatment and supports prioritization. The attacker types help determine the appropriate Security Level according to IEC 62443 and derive suitable security measures from the standards IEC 62443-3-3 for system security and IEC 62443-4-2 for secure product development.
Security measures must comply with the European Cyber Resilience Act and the applicable regulatory requirements of the manufacturing company. Other standards may also be used, provided they ensure compliance with industry-specific laws and requirements.
Once the security measures have been defined, the risk is reassessed after their implementation in order to determine the residual risk. This is calculated by subtracting the risk after implementation from the original risk. Once an acceptable residual risk has been reached, the measures are added to the table.
Threat modeling results in a living document that must be reviewed at least annually and updated whenever security-relevant system changes occur. It ensures that many potential threats are identified and addressed during the design phase and is therefore a key element of a secure product development lifecycle.
Further details on the CERTAINITY threat modeling methodology for manufacturing companies will be provided in the next and final article of this series. There, the four phases of the methodology will be explained step by step using a practical example.
CERTAINITY is happy to support you in modeling your Industry 4.0, OT, and IT landscape as well as in identifying, assessing, and prioritizing your risks.